Adding Charts
Mindshow currently supports adding four types of charts: tables, bar charts, line charts, and pie charts. Other types of charts will be added in the future.
How to Add Charts
1. Click the plus sign in front of the node where you want to add a chart

2. Select the desired chart type from the chart options
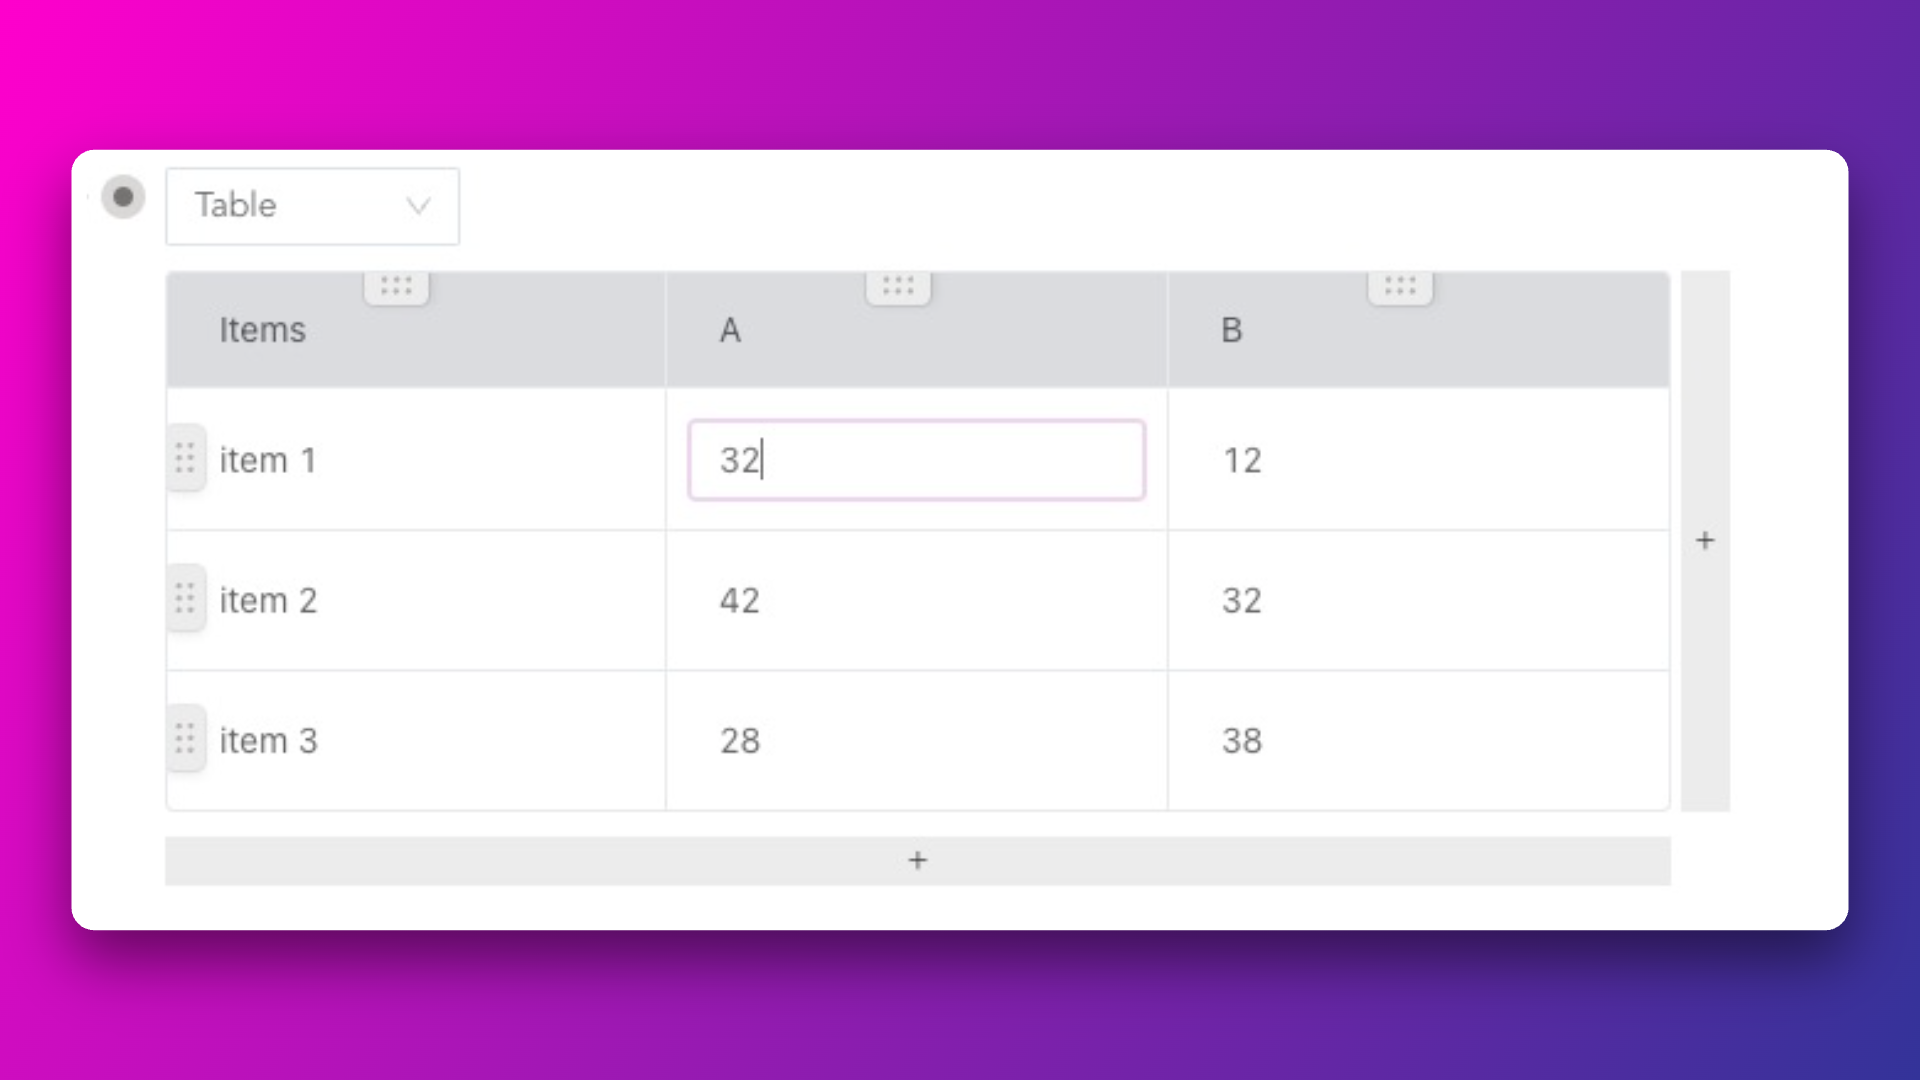
3. After adding, click the chart to edit it directly
Inserting Special Charts
You can create charts in software like Excel, save them as images, and then insert these images into your Mindshow document.